Google Analytics forms the backbone of many companies’ online business monitoring. It’s a natural choice, given the wealth of information it offers. However, the volume of data can be overwhelming if not managed properly. To make the most out of Google Analytics, it’s important to focus your monitoring on specific business goals.
Every business website has certain goals: some aim primarily to boost brand awareness, while others try to facilitate sales directly. Similarly, each website should be monitored using different parameters, ones that are relevant to its objectives. By focusing your monitoring on specific indicators, you can get better insights out of Google Analytics without spending too much time sifting through data.
Below are some common business website goals, along with their relevant indicators. Included in each are some of the contextual clues to look out for when making your analyses.
Increasing Awareness
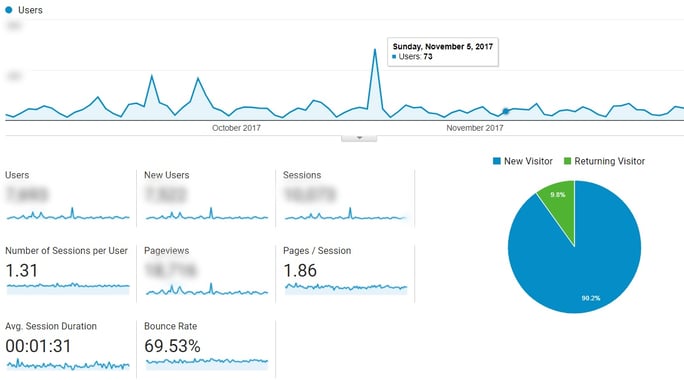
The basic indicator for awareness of your website is site visits, which can be found on the dashboard of your Analytics account. Be sure to check what percentage of them are new visitors—people returning is good for business, but not specifically for raising awareness.

Google Analytics Dashboard - Tracking Traffic and Engagement
If you’re targeting a specific segment, you should also check where your visits come from, both geographically and digitally. You can find the physical locations of your site visitors using a Map Overlay or by inferring from user Language, both in the Visitors Tab. Meanwhile, you can find the source of your web traffic in the Traffic Sources tab. This can be useful for deciding how to promote your site. Should you focus on prolific sources, or expand to new platforms?

Google Analytics: Traffic Acquisition Channels (Organic Search, Direct, Social, Referral)
If you maintain an active presence on other sites (such as social media pages), you may find your awareness rising there, especially if people prefer those channels over your actual site. That might be fine, but it may also be a sign you should reconsider what your website offers and how it does so.
Getting Leads, Making Sales
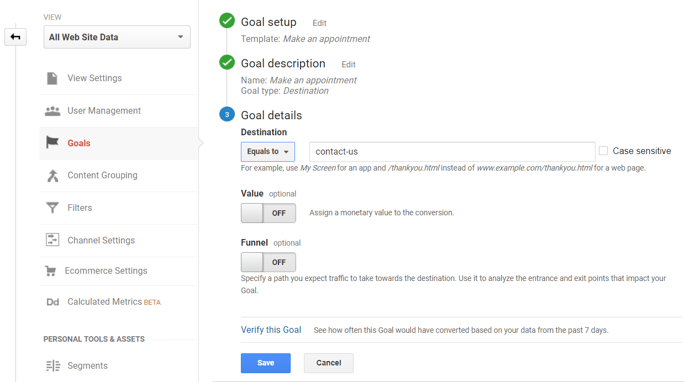
These are best monitored by setting up specific goals in Google Analytics. The platform allows you to customize these in the Goals tab. It may take a bit of time, but it will provide valuable data, and is thus worth the effort.
Tracking leads and sales will partly depend on how your website is set up. Typically, leads can be tracked through form completion, since that’s the way most websites gather leads. Similarly, a common way to track sales would be by monitoring how many users completed the checkout process.

Google Analytics: Goal Setting
Perhaps more useful, though, is seeing how users get there—or don’t. Reversing a Goal Path, for instance, lets you see what users were doing before they completed your goal, which could show you what’s good at leading customers to convert. Meanwhile, looking at Goal Abandonment Funnels and Funnel Visualizations can show you where in the process users typically drop out. There may be errors there that demand swift correction.
Increasing Customer Engagement
Customer engagement is determined by the composition of your website as well as the nature of its individual pages. For instance, if your pages have comments sections or forms to complete, tracking user engagement can be fairly straightforward.
For other pages, however (such as blog entries, informative pages, or navigation pages), it’s somewhat more complex. For these, you’ll need to refer to both Average Time on Site and Bounce Rates.

Google Analytics user behavior on top most viewed pages
For an informative page like a blog entry, for instance, bounces aren’t such a bad thing—provided your users are consuming the content they’re supposed to. As long as Time on Site lines up with the approximate time it takes to process the information, then you can consider the page a success.
On the other hand, if users spend a lot of time on navigation or menu pages, that might be a bad sign: something on those pages may be confusing readers, keeping them from proceeding as swiftly as they should.
Bounce Rates also have a somewhat more direct effect on Time on Page: bounces are recorded with a time of 0, which could skew averages if your bounce rate is especially high. For that, and the above reasons, these two factors should be considered in light of each other.
Of course, all of these metrics are ultimately related. Understanding how all of them work will provide deeper, more dependable insights from your data monitoring. Nonetheless, knowing which measures pertain most directly to your business goals will help in refining your SEO strategy and website design choices.
To see how SEO and search advertising can improve your online marketing performance, check our SEO packages.


Comments